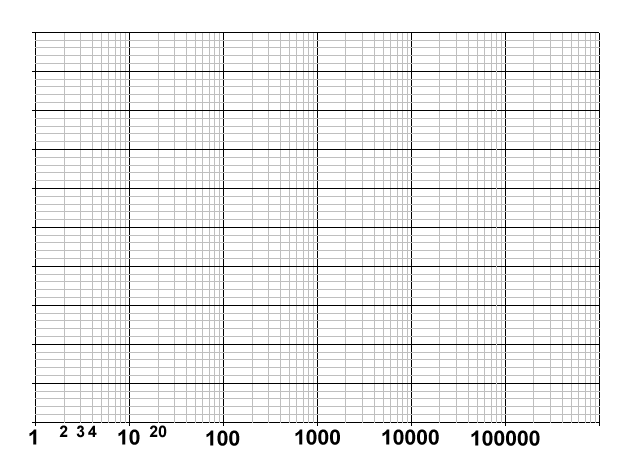
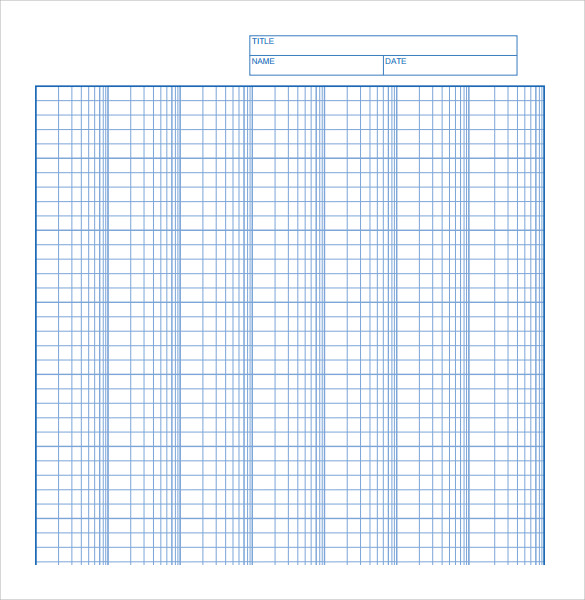
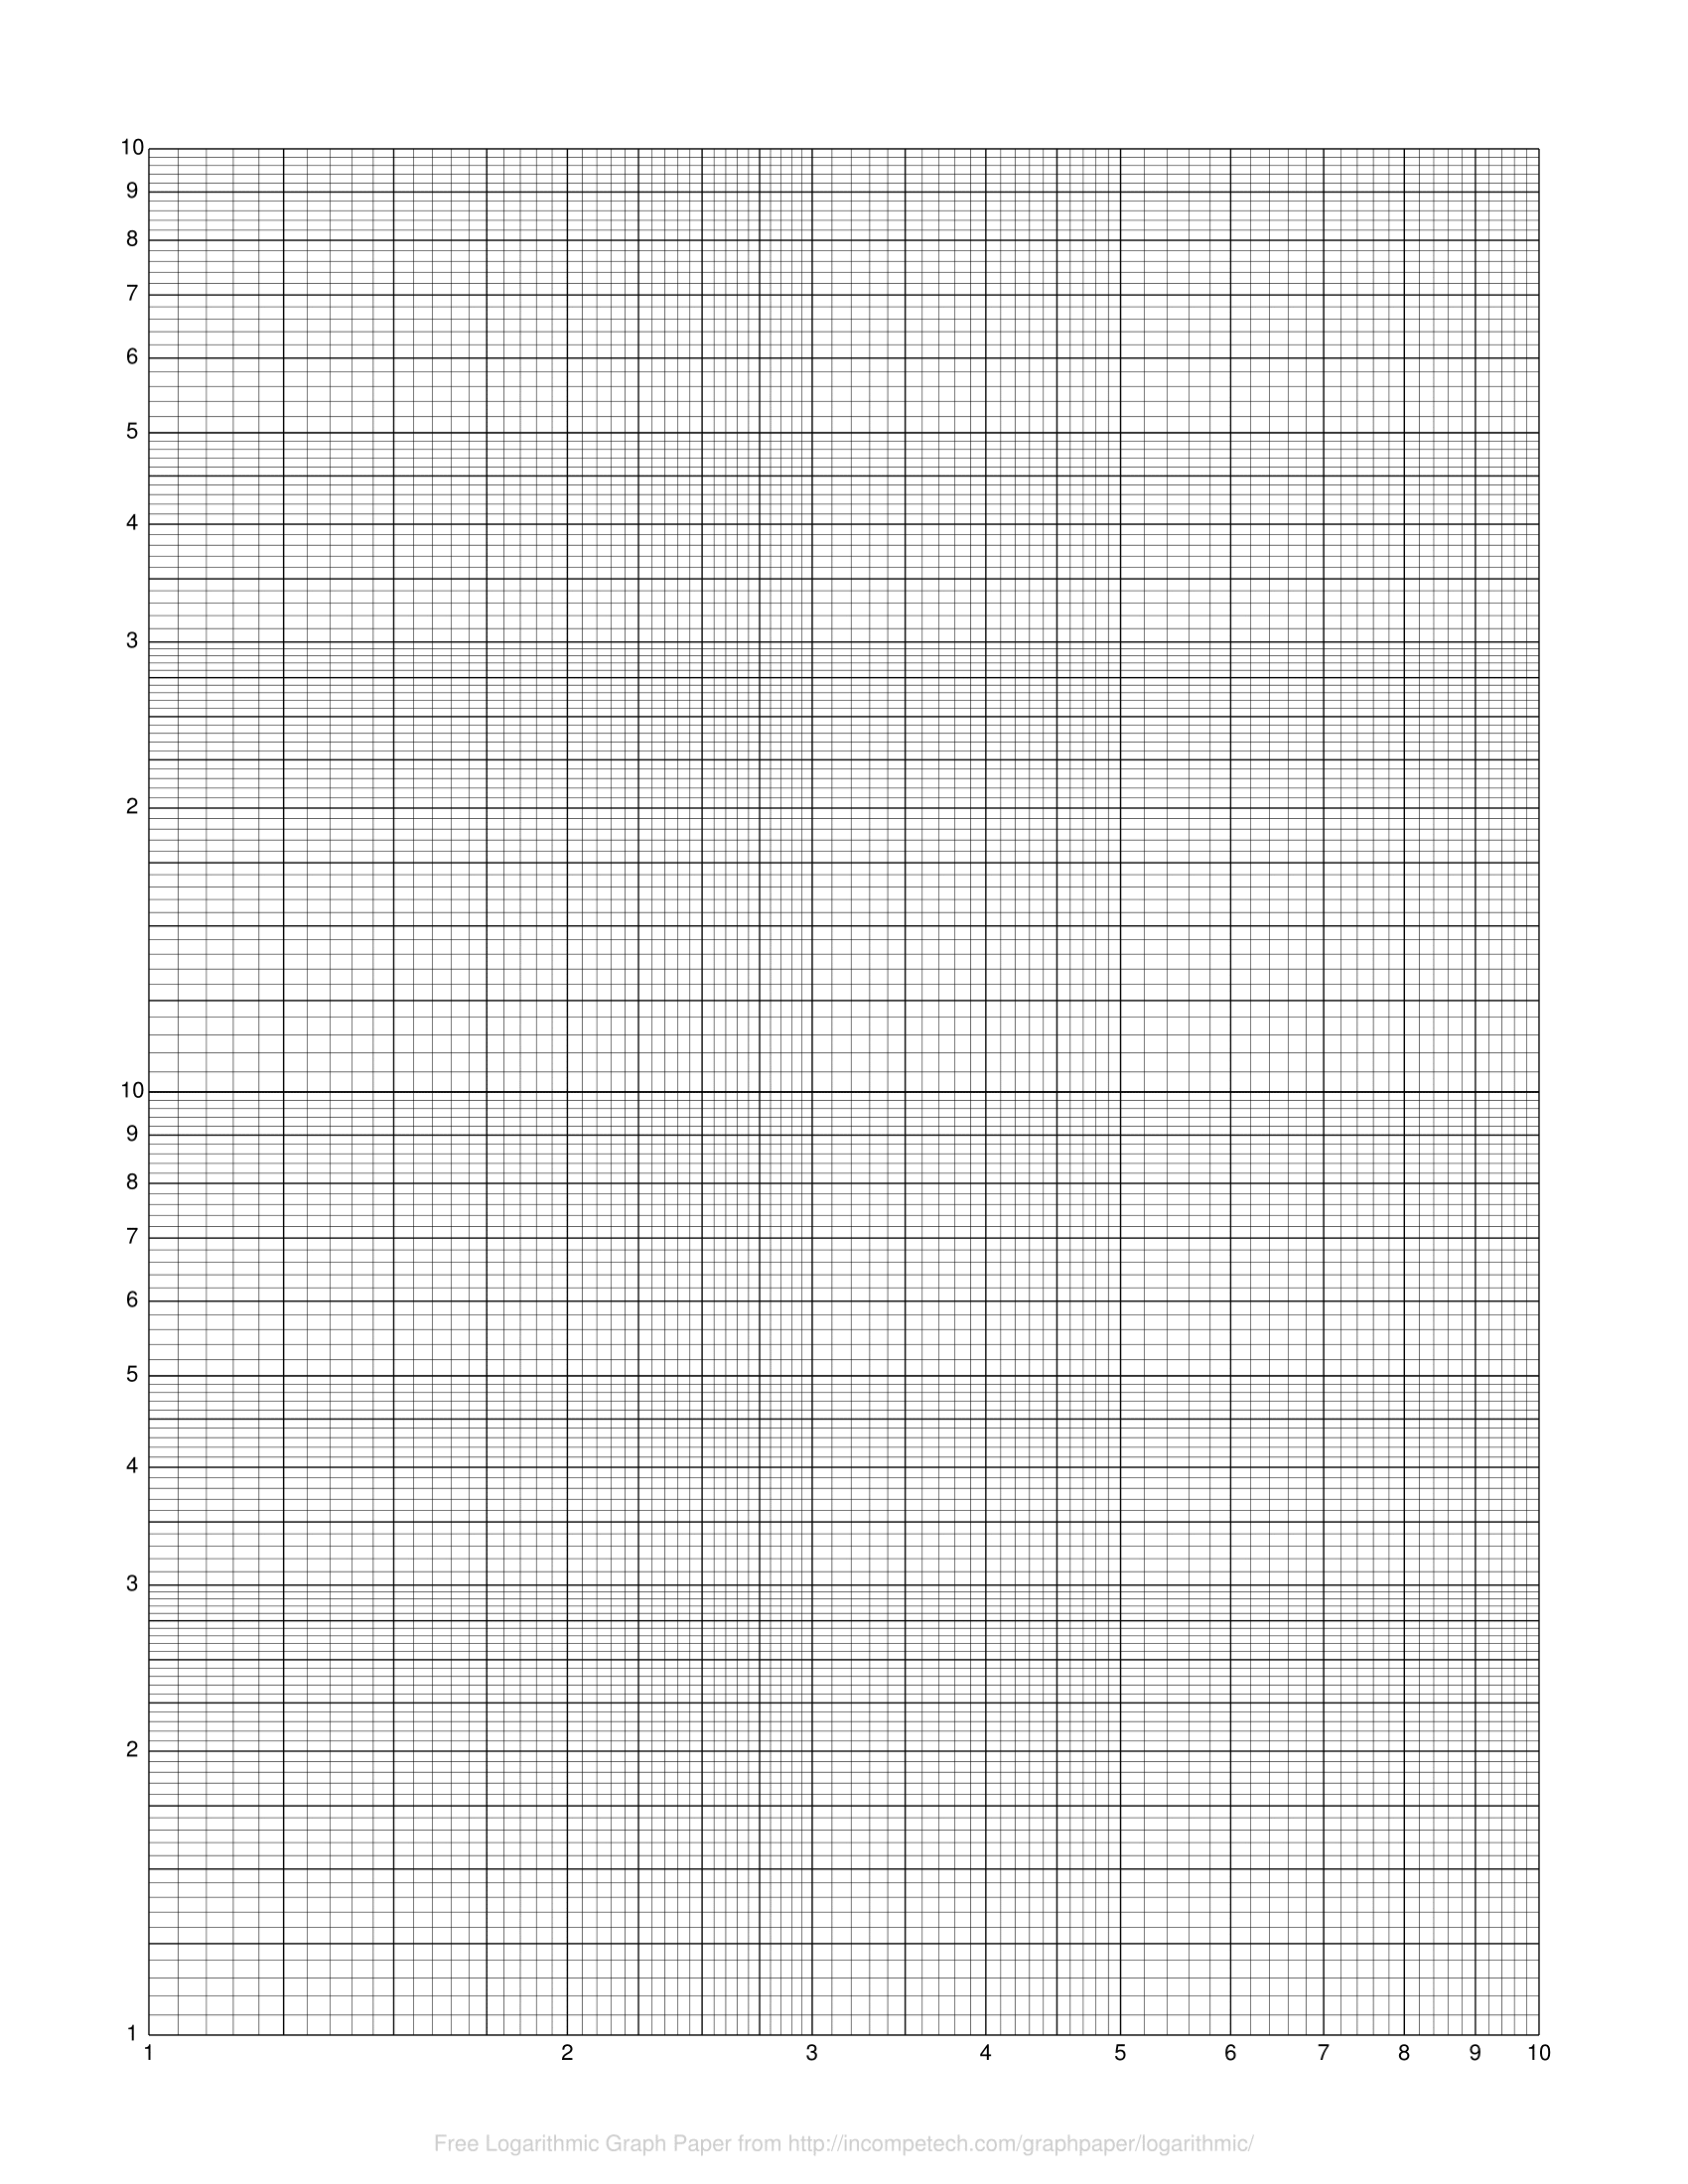
A Semi Log Graph Paper or semi-log plot is a method of visualizing data. It is related to an exponential relationship in science and engineering. On a logarithmic scale, one axis is plotted. When one of the variables being plotted covers a large range of values and the other has only a limited range. Such a plotting method is useful in a semi-log graph paper.
- Polar Graph Paper
- Coordinate Graph Paper
- Grid Paper
- Transparent Graph Paper
- Dot Graph Paper
- Triangle Graph Paper
- Graph Paper with Axis
- Hexagonal Graph Papers
- A4 Graph Paper
- Isometric Graph Paper
Printable Semi Log Graph Paper

The greatest advantage that the user can derive is that he/she will be able to bring about excellent features in the data. However, this cannot be seen if both the variables are plotted in a linear direction.

Features
The user can observe that a semi-log graph paper is a simple graph paper that reflects one log axis followed by a linear axis. The purpose of using such a graph paper is that the user finds the range of data in one axis to be extremely large or does not follow a linear progression. Under such a scenario, it will enable to easily extrapolate the data as the range here is much more spread out.
Making a Semi-log graph

Here, in the first instance, the user has to decide which axis he would like to make logarithmic. In fact, it has to be understood that a logarithmic graph. It shows that both the axes are logarithmic. On the other hand, a semi-log graph shows that only one of the axes is logarithmic.
Here, the user has to double click that axis and thereafter, click on the scale tab. By doing so, the user can check the box corresponding to the “Logarithmic Scale.” Under such a situation, the graph plotted will become semi-logarithmic. The labelling and reading of semi-log graphs are easy. It may be seen that a semi-log graph is identical in concept to a graph generated on Cartesian paper.
Leave a Reply